The enigma of small caps... or of large ones ? - 18 March 2024
The underperformance of European small caps against indices is filling a lot of column inches. Is it all an illusion or a genuine issue ?
Since the start of the recovery of the stock market – i.e. when it was at its lowest ebb in November 2022 – European small caps appear to be lagging behind the rest of the market.
Upon closer inspection (cf. chart 1), that impression is misleading in some respects. Mid caps (€7 billion average capitalisation) have, in fact, performed the same as small caps (€1 billion average capitalisation). So, what we can observe is more of a stock market trend currently favouring large caps in general, and a few titans in particular.

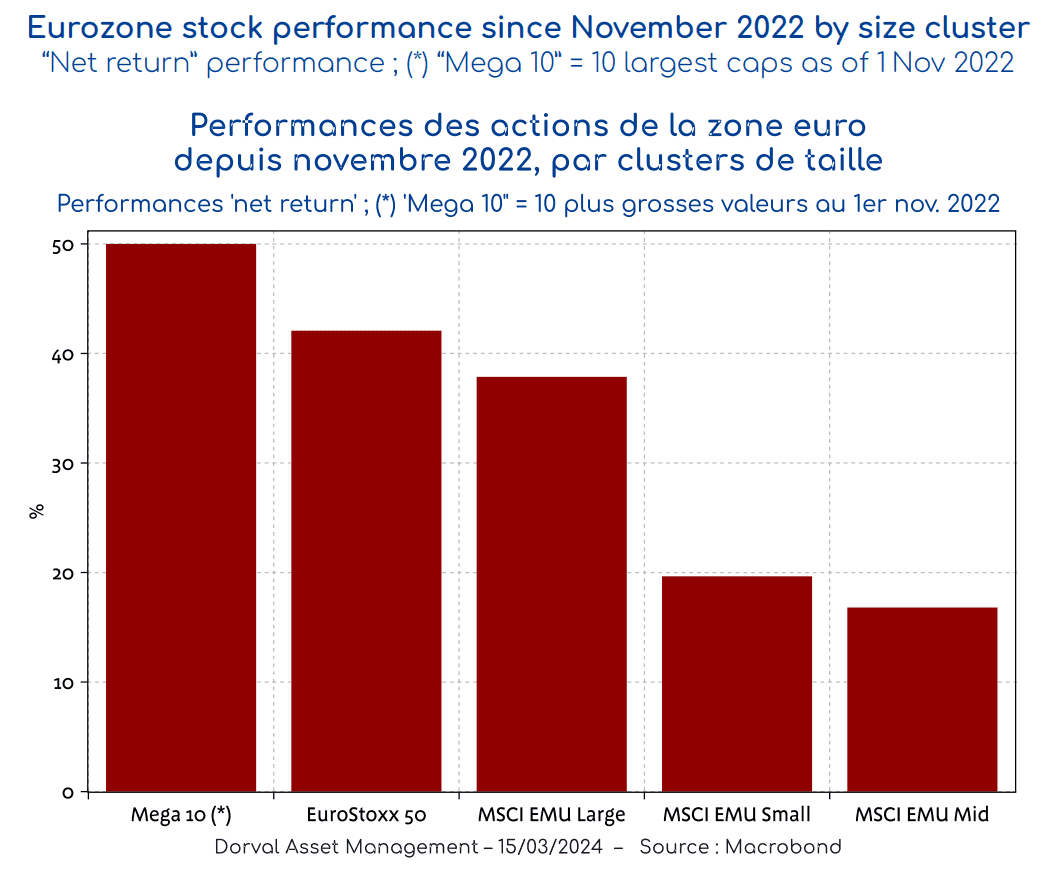
Finer analysis reveals that this “large cap” effect is not chiefly due to sectoral composition differences between the indices. According to Bloomberg calculations, while the Euro Stoxx 50 has outperformed the MSCI EMU Small Cap Index by 22% since 1 November 2022, sectoral differences account for only 6% in that regard.
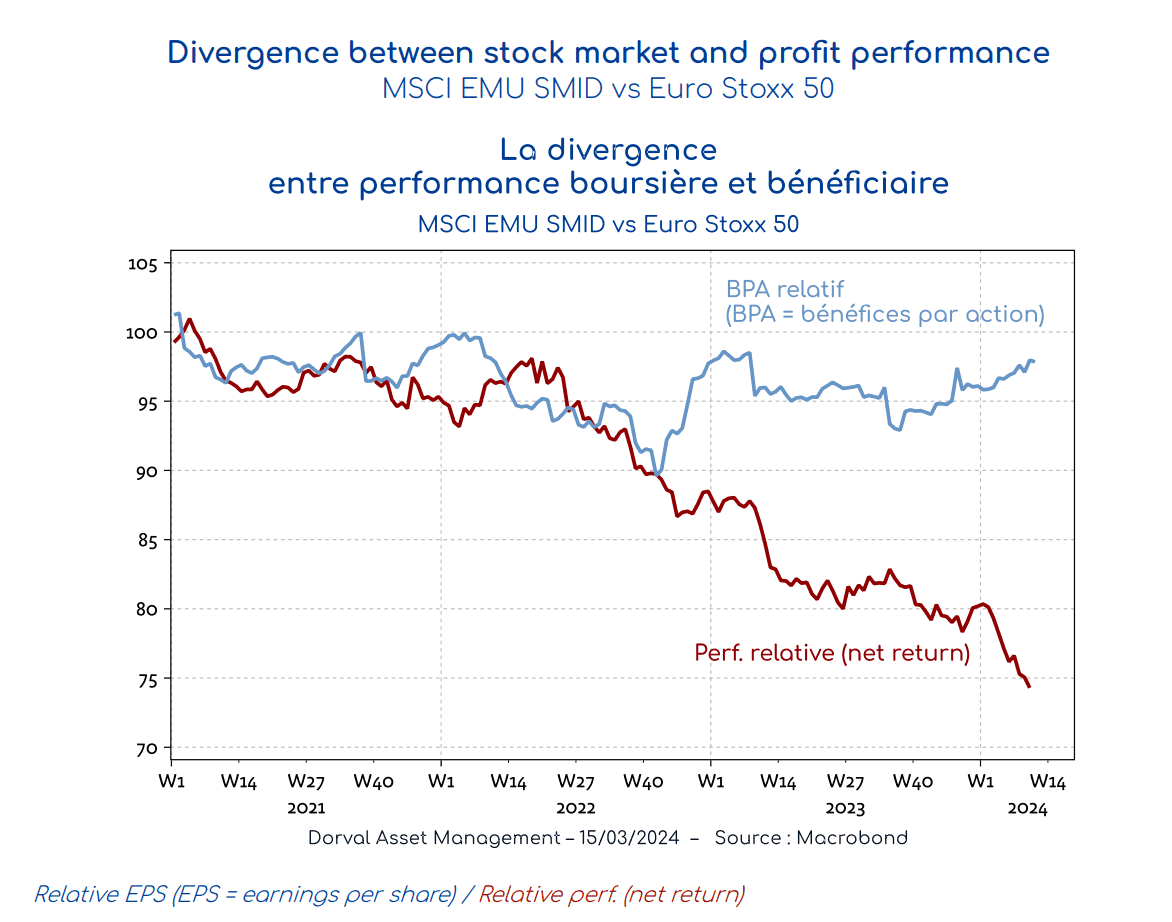
One possible explanation is earnings, the question being whether large caps outperformed small caps simply because their profits piled up more quickly ? Well, no. Because in terms of EPS (earnings per share), small and mid caps have not performed badly at all. Their EPS have, in fact, risen at the same rate as companies in the Euro Stoxx 50 over recent years, which is in stark contrast to relative stock market performance (cf. chart 2). This result runs contrary to the oft-advanced idea that the small caps’ profits suffer more than large caps’ due to the greater impact of Europe on their turnover.

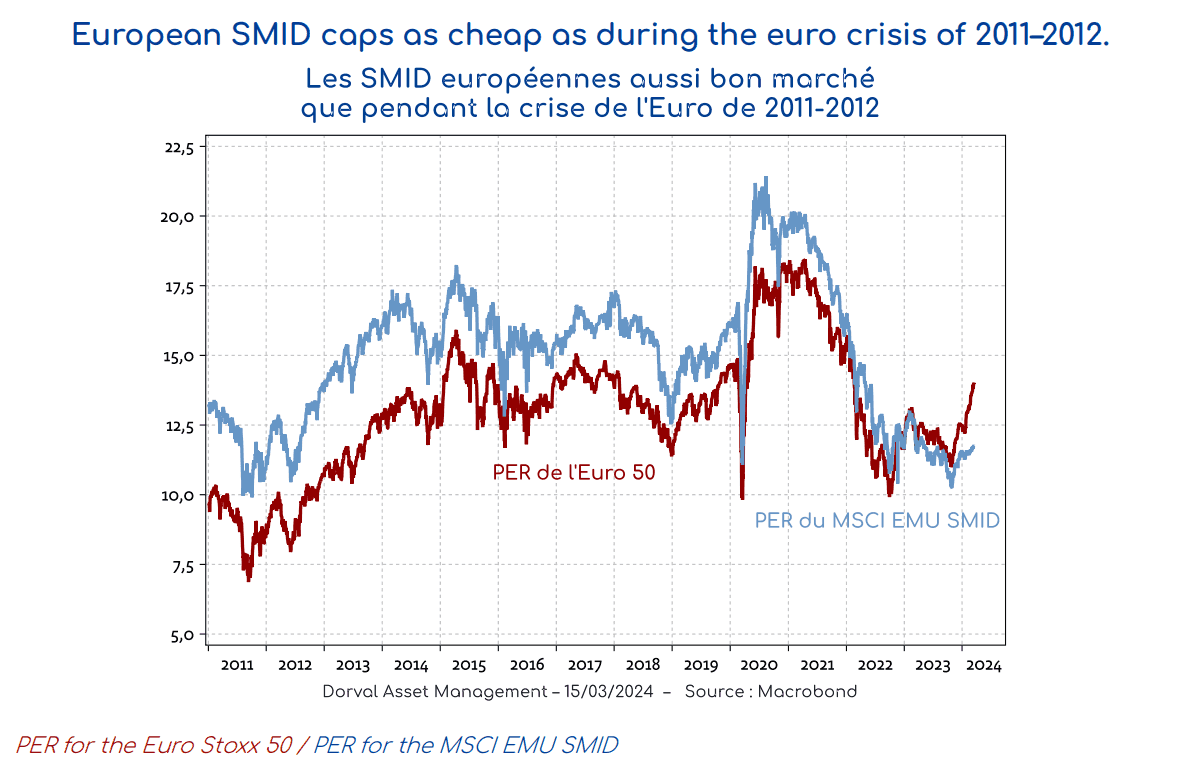
The mathematical result of this divergence between economic and stock market performance is a fall in terms of valuation (cf. chart 3). Not only has the PER of small and mid caps gone above that of very large caps for the first time, their absolute PER is at the same level as during the existential euro crisis of 2011–2012. Such large falls seem difficult to explain. At this level, the European SMID cap universe looks very attractive to us.

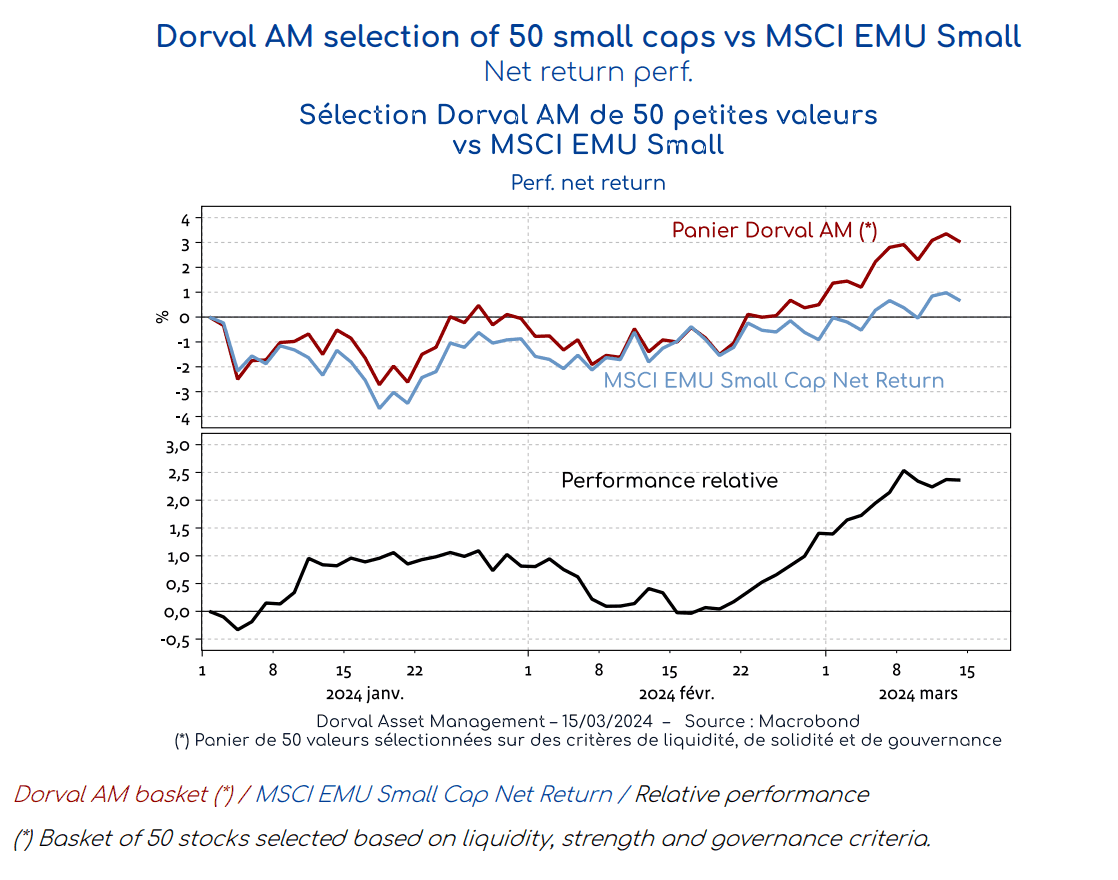
In our European flexible funds, we maintain a significant level of exposure of 8.5% to eurozone small caps. This exposure takes the form of an equally weighted basket of 50 small caps to which we have applied liquidity, financial strength and profit growth filters, and which are set apart by their governance ratings. This basket is currently outperforming the MSCI EMU Small Cap index (cf. chart 4).